
Delivery statistics: the operational dashboard
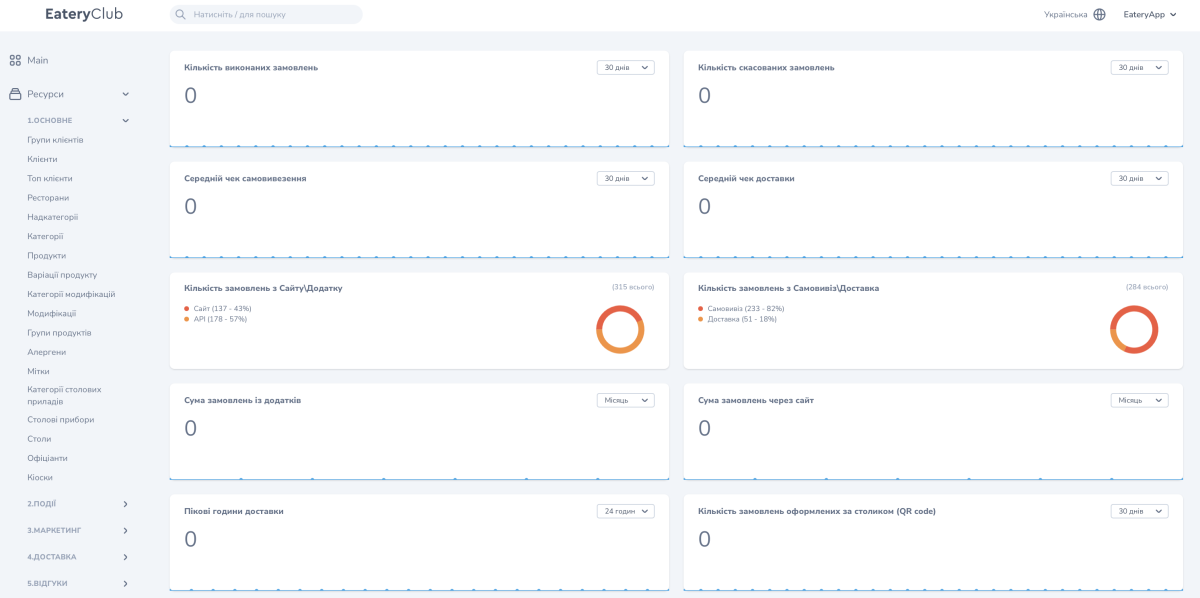
The delivery statistics section in the Eatery Club admin panel: completed and cancelled orders, average order value, channel split and peak hours.
Updated: 07.09.2026The «Статистика доставки» (delivery statistics) section gives an operational snapshot of orders: how many were completed and cancelled, the average order value, how orders split between channels and which hours carry the most load. Open the section from the «4.Доставка» (delivery) group of the side menu.
What the dashboard shows
- «Кількість виконаних замовлень» and «Кількість скасованих замовлень»: how many orders were completed and how many were cancelled.
- «Середній чек самовивезення» and «Середній чек доставки»: the average order value for pickup and for delivery separately.
- «Кількість замовлень з Сайту\Додатку»: how orders split between the website and the app, as a pie chart with each channel’s share.
- «Кількість замовлень з Самовивізі\Доставка»: the ratio of pickup to delivery.
- «Сума замовлень із додатків» and «Сума замовлень через сайт»: the revenue of each channel.
- «Пікові години доставки»: the hours with the heaviest load.
- «Кількість замовлень оформлених за столиком (QR code)»: orders placed at the table through the QR menu.
The tiles with numeric figures have their own period selector: the screenshot shows the values «30 днів» (30 days), «Місяць» (month) and «24 годин» (24 hours). The two pie charts for channels and fulfilment types show a total and carry no period selector.
Where to get financial reports
The dashboard shows operational figures for orders. Take POS and shift reports from the POS system: it is the source of truth for finance.
